

Making Timely Sense of performance.now! ⏱️
If we need a quick way to check how fast (or not!) our code is running, use the high-precision performance.now() method.

Hi everybody - when it comes to measuring our web app’s performance, we have a boatload of tools available to instrument, measure, and analyze almost everything. We don’t even have to go too far in finding these tools. The Chrome DevTools give us almost everything we need (and then some!):

To get a deep dive into these capabilities, check out this excellent article that walks through the cool parts of the Chrome DevTools’s Performance Insights panel.
Something Much Simpler
Many times, what we want to measure doesn’t need all the extra insights we get from the DevTools. We just want to know how long it takes for a particular piece of code to run. That is where the handy performance.now() method comes in.
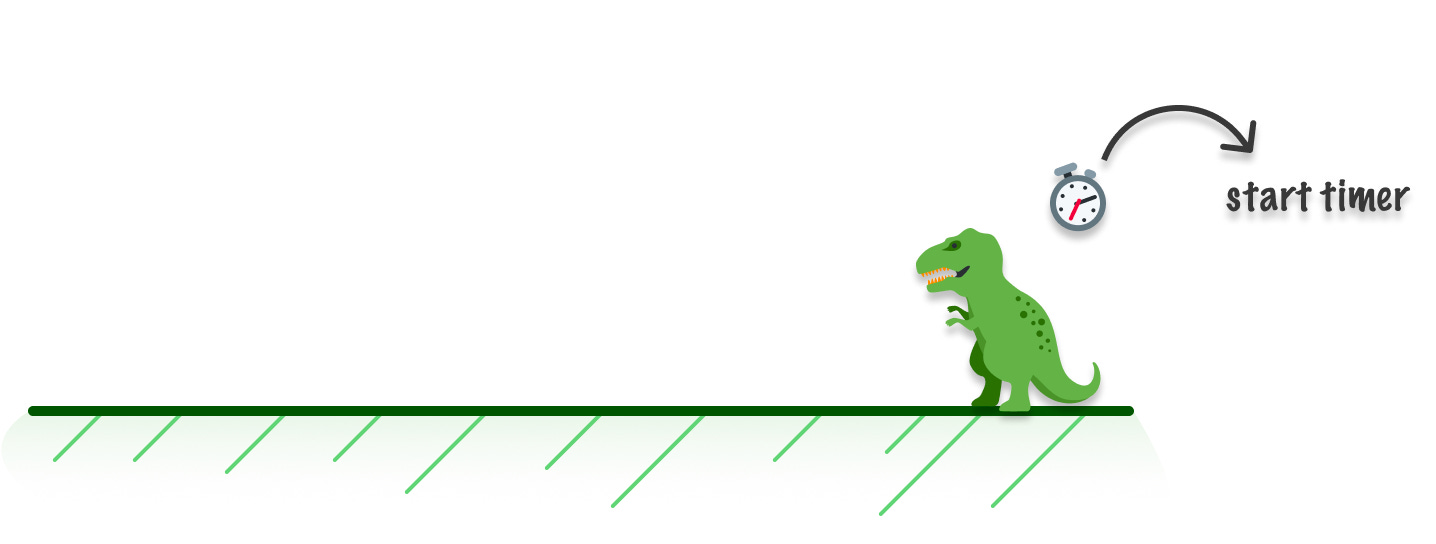
Before we talk about performance.now(), let’s take a detour. Imagine that we are using a stopwatch to measure the time it takes someone to complete a race. At the start of the race, we start our stopwatch and jot down our starting time:
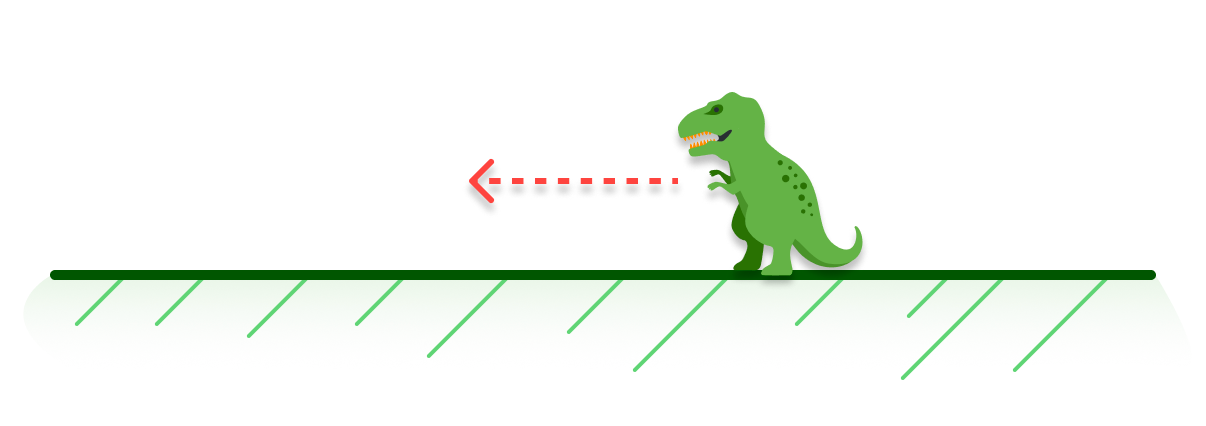
The race is underway. While the race is ongoing, real-world time is ticking:
When the race ends, we hit our stopwatch again and jot down the time at the current moment:
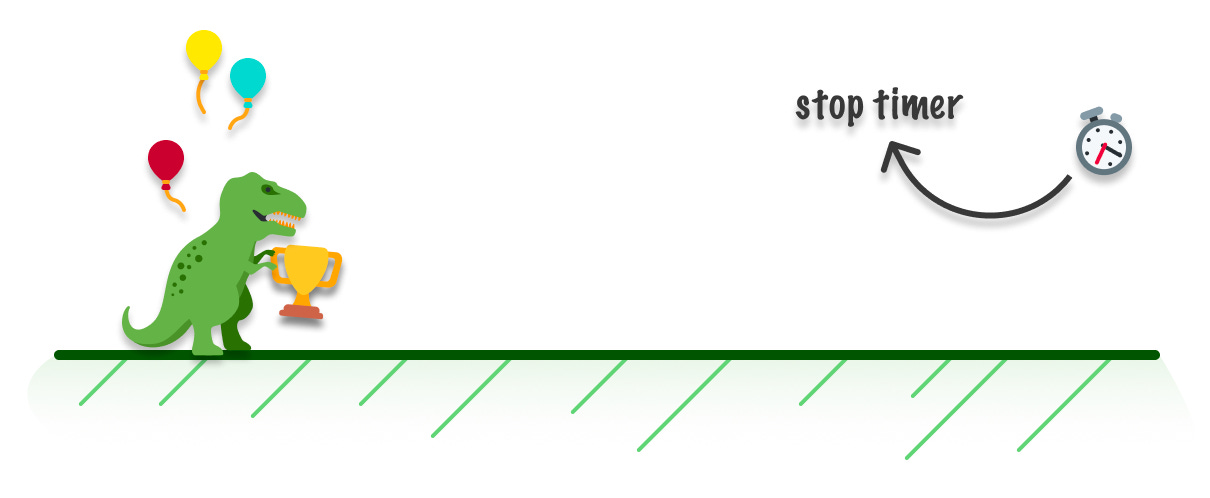
How long did the race take? Well, that is the difference in the time values between when our stopwatch was started and stopped.
The way we would use performance.now() is similar to the stopwatch. Each time we call performance.now(), we get a high-precision timestamp of the current real-world time:
performance.now(); //Timestamp is: 8960.69999999553The code whose performance we want to measure is like our race. If we call performance.now() before our code runs and call performance.now() again after our code (whose performance we want to measure!) runs, we have two moments in time whose difference is the time it took our code to run.
The following example highlights how this works:
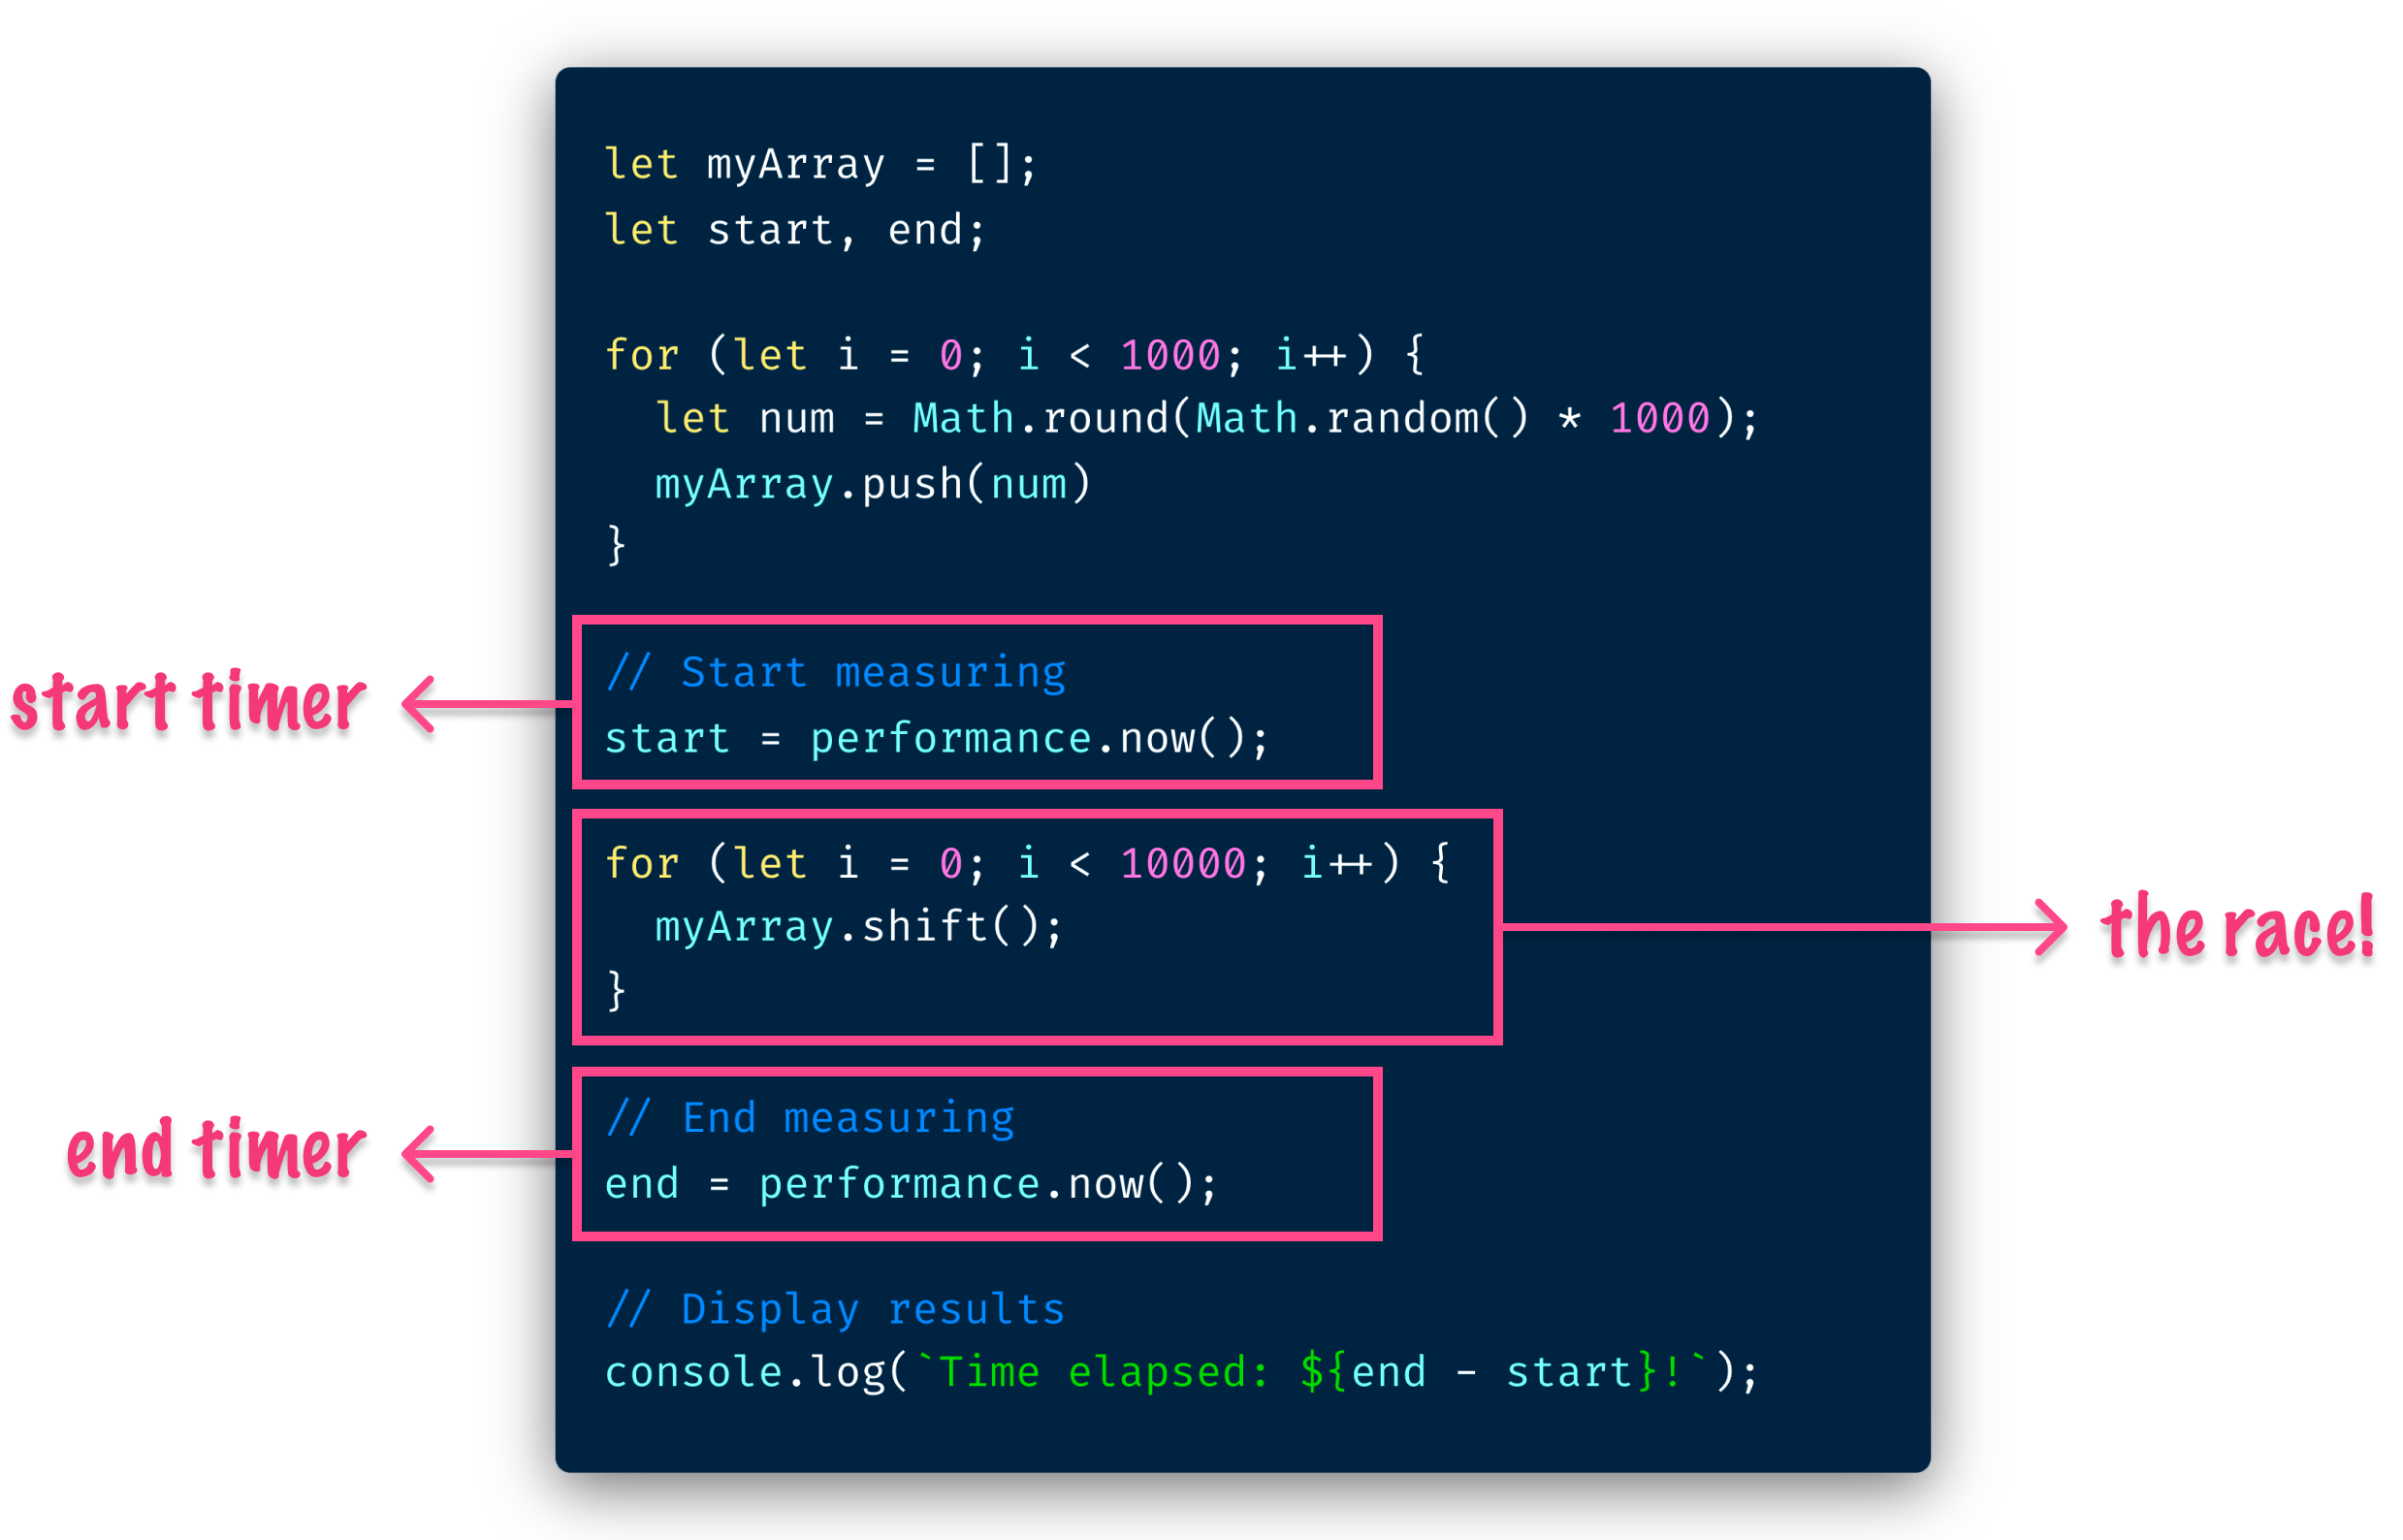
An important detail to note is that what we are doing here is just getting a rough idea of running time. If we refresh your browser and re-run the same test, it is very likely the numbers will vary. Sometimes the numbers will be higher. Sometimes the numbers will be lower. If we test on a different browser with a different JS engine, the results would be wildly different as well. Measuring performance is hard!
Till Next Time
There is one more detail to call out. Our performance.now() is powered by the DOMHighResTimeStamp data type. This is a newish data type introduced not too long ago to give us more predictable and accurate timing details. If you want to really wow your friends and family, this same DOMHighResTimeStamp value is what is used in our requestAnimationFrame timestamps, Web Animations API internals, and in a few other places.
Lastly, almost all of my posts here are inspired by some real-world shenanigans that I got myself involved. This one is no different where I went down the rabbit hole of comparing the performance of arrays to linked lists:
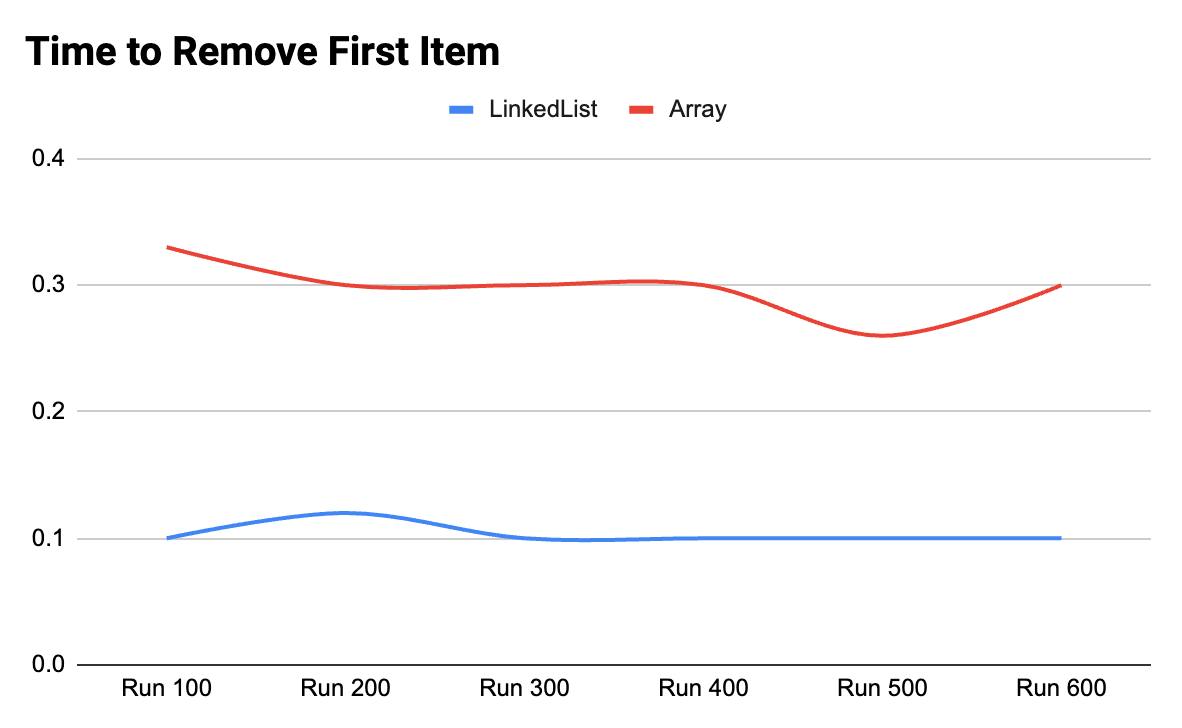
The results may surprise you…or not! 🤣
As always, I like to hear from you. If you have any questions or comments, feel free to ping me via Twitter or post on the forums. If you found this newsletter posting helpful, please do forward this to your friends and enemies.
Cheers,
Kirupa 😇